
Chart & Graph Infographics Elements UI Kit for Figma, Sketch, Adobe XD & Photoshop | Data Visualization Dashboard Components, Analytics Charts, Business Reports, Editable Vector Graphics
Transform complex data into engaging visual stories with this professional Chart & Graph Infographics Elements UI Kit.
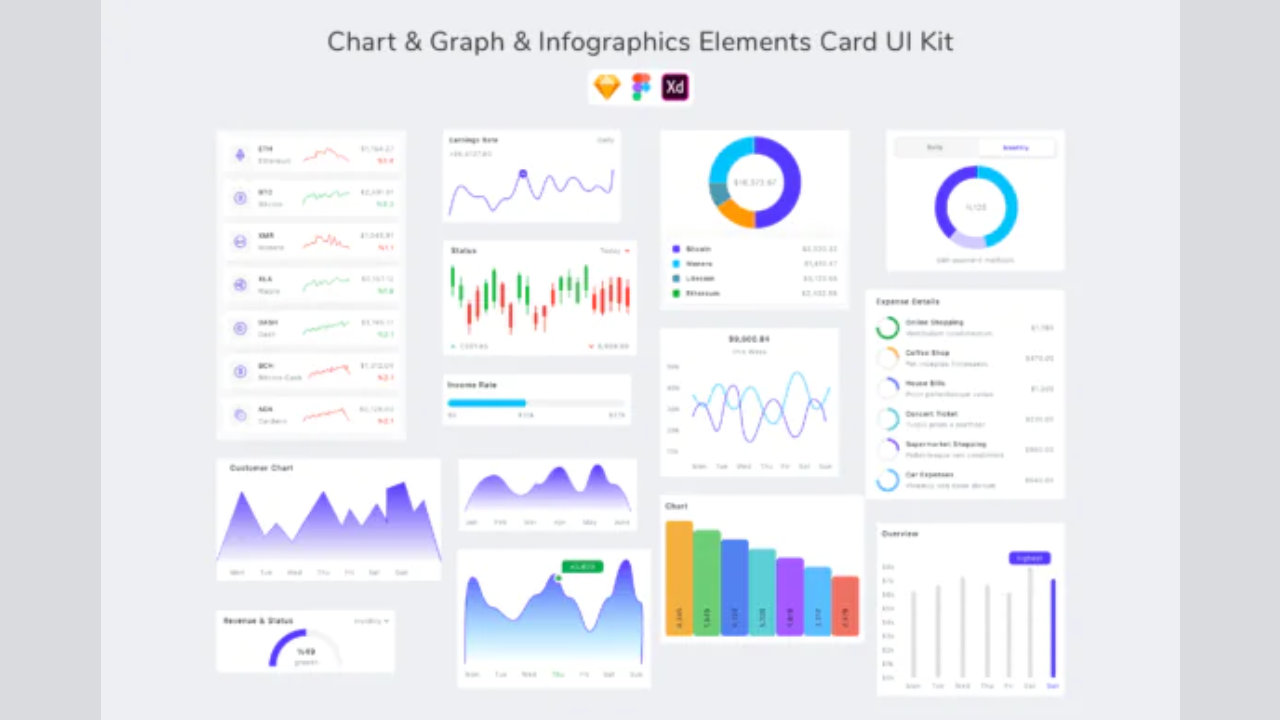
Transform complex data into engaging visual stories with this professional Chart & Graph Infographics Elements UI Kit. Designed for modern digital products, dashboards, business presentations, analytics platforms, and data-driven applications, this comprehensive collection provides beautifully crafted infographic components that help designers create impactful visualizations quickly and efficiently.
Built with current UI/UX trends in mind, this versatile kit includes a wide range of charts, graphs, statistical widgets, and infographic elements suitable for websites, mobile applications, SaaS dashboards, business intelligence platforms, marketing reports, financial analytics, and corporate presentations.
Whether you're creating KPI dashboards, performance reports, financial summaries, marketing analytics, or data visualization projects, these pixel-perfect components allow you to build professional interfaces without starting from scratch. Every element is fully editable and organized for seamless customization.
Key Features:
- Compatible with Figma, Sketch, Adobe XD, and Adobe Photoshop
- Modern and professional infographic design system
- Pixel-perfect UI components
- Editable charts and graph elements
- Fully customizable colors, typography, and layouts
- Well-organized and layered files
- High-quality vector graphics
- Scalable and responsive design elements
- Free fonts and icons included
- 100% customizable vector shapes
- Easy-to-use design assets for rapid prototyping
- Suitable for web, mobile, dashboard, and presentation projects
- Regular updates and improvements
Perfect For:
- Business dashboards
- Analytics platforms
- SaaS applications
- Financial reports
- Marketing presentations
- Data visualization projects
- Admin dashboards
- Corporate presentations
- Startup pitch decks
- Mobile analytics apps
- KPI tracking systems
- Business intelligence tools
Create visually compelling reports and dashboards that communicate data clearly while maintaining a polished, professional appearance. This infographic UI kit saves valuable design time and helps you deliver high-quality results faster.
Earn $5.08 per sale
Share this product and earn 50% commission on the price excluding GST for every eligible purchase within your attribution window.
Join affiliate programProduct Details
Related Products

Christmas Funny Cat T-Shirt Design SVG PNG EPS | Cute Xmas Cat Graphic for Print on Demand, Sublimat

Christmas Crew Vector T-Shirt Design SVG PNG EPS JPG | Funny Holiday Group Shirt Graphic for Print o